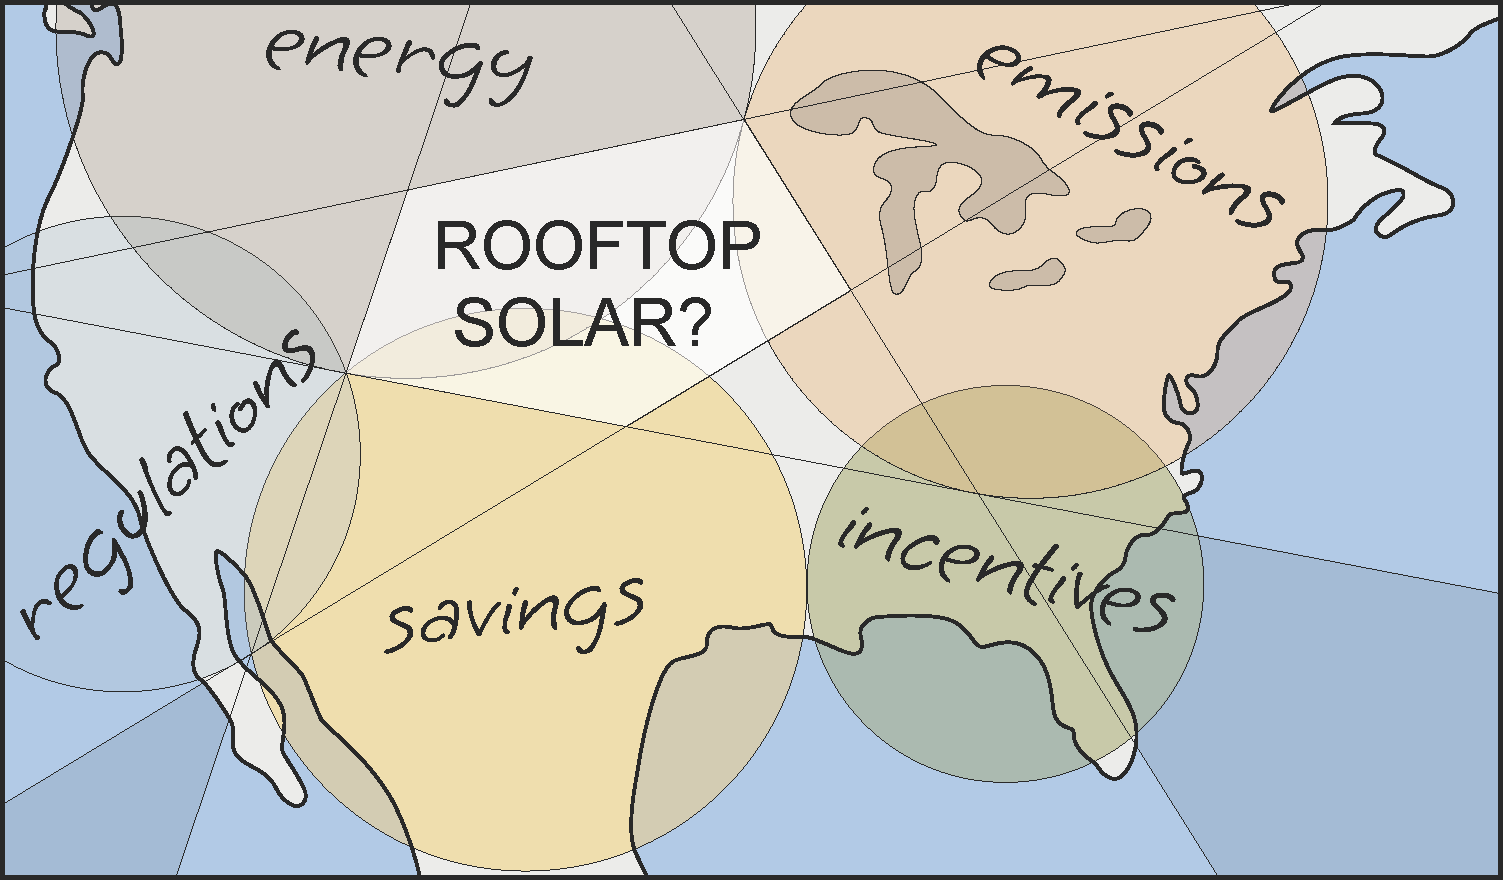
You May Be Adding PV To The Wrong Building


For new buildings, the decision to include rooftop photovoltaics (PV) is getting easier. Tax credits, market demand, increasing regulations, and just plain economics are helping to green-light more solar installations than ever.
But what if you have multiple properties to choose between? What is the best way to prioritize investments across a portfolio? Is it better to optimize value, energy, or emissions?
- Maximize value: Select projects that provide the highest ROI or NPV. Regions with high electricity costs and robust incentives will rise to the top.
- Maximize energy: Focus on the MWp capacity installed, or the MWh of electricity generated annually. This strategy will emphasize larger projects in locations with sunny skies.
- Minimize risk: Seek opportunities to address assets with poor performance. Identify properties in states and cities that are establishing penalties for exceeding emissions thresholds (For an overview of these law, see the DOE’s online summary).
- Minimize emissions: Fund rooftop PV where it provides the greatest reduction in greenhouse gas emissions.
While these metrics are interrelated, emissions is the one gaining the most attention. Emissions reduction is the driving force behind renewable energy in the first place, and arguably the most material metric for our communities. However, estimating the emissions reduction from a PV project is complicated by several aspects.
- Not all grids are equal. Some regions have cleaner grids with less fossil fuel generation. Adding rooftop PV in a region with a clean grid will result in less emissions reduction than if the same grid was added to a dirty grid. In 2026, Installing PV in Missouri instead of Texas would result in four times greater emissions reduction [footnote 1]. By prioritizing areas with dirty grids, portfolio managers can achieve more reduction with a similar investment.
But it’s more complicated.
2. Tomorrow’s grid emissions are not today’s. PV is a 25-year investment, and our grids are changing fast. For example, Ontario, Canada has a clean grid powered mostly by hydro and nuclear plants. It might be one of the last regions to prioritize for PV if the goal is to reduce emissions. However, new demand is stressing the grid and new natural gas power plants are anticipated. The Ontario grid is likely to become much dirtier in the near future. Therefore, it may be one of the best places to install rooftop PV, even though you would not see that based on today’s data.
But it’s more complicated.
3. Emissions from energy generation changes from hour to hour. We use more energy during the day than at night. Utilities respond by ramping up peaker plants, typically fueled by natural gas. When the peaker plant is running, the emissions from electricity use will be higher. Adding PV to this type of grid can have an outsized impact by reducing use when emissions are greatest. Portfolio managers can maximize value from PV by evaluating grid peak emissions factors in addition to the annual average.
Portfolio-level analysis can pay off. Focusing on the metrics that matter most – whether that’s return on investment, greenhouse gas emissions, or asset risk – is the starting point for portfolio optimization. And as always, the most cost-effective way to reduce impact is by improving the performance of inefficient properties. See this article on electrification from the USGBC for a great overview of that process. The same type of analysis can identify the best locations to install PV. Working with a building science consultant provides assurance that your renewable energy strategy is tuned to your long-term investment goals.
Footnote 1: Under the Greenhouse Gas Protocol, emissions from purchased electricity are reported using the average residual emissions factor for the local grid.
View More Resources
Benefit from our expertise